|
Consulting |
Abbreviations |
Search |
NYISO Files Updated ICAP Demand Curves
Email This Story
December 1, 2010
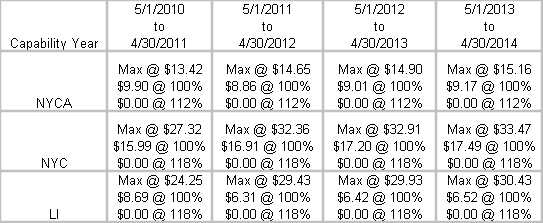
The New York ISO has filed with FERC an application to set the ICAP demand curves for the Capability Years of 2011/2012, 2012/2013 and 2013/2014.
The ICAP Demand Curves would be established at the following points:
NOTE: All dollar figures are in terms of $/kW-
The current shape and zero crossing points of the demand curves would not change. While some stakeholders have objected that the current Demand Curve is too shallow, which, if true, would mean that the Demand Curves were overcompensating suppliers, NYISO found no basis to support such an argument. The NYISO, "believes that its proposal to continue with previously approved slopes and zero crossing points is the most reasonable approach.
"Slope and shape adjustments can have unpredictable but significant impacts on projected Capacity revenues. For example, it would result in lowering capacity compensation, which could significantly increase investors' perception of risk and significantly raise the levelized costs of entry," the NYISO said.
The NYISO is proposing that the level of excess capacity in NYCA be modeled at 1%, with NYC modeled at 1.1%, and LI at 2.1%. The estimated excess capacity levels that are proposed are lower than those in the previous Demand Curve reset in part because the NYISO, "determined that it is appropriate to set the level in relation to the size of the peaking unit used to establish the Demand Curves rather than on a larger combined cycle unit (as was done in the 2007 reset)."
The NYISO's recommendation results in estimated energy and ancillary services revenue
(net revenue offset) of $27.44/kW-
The NYISO is not recommending that anomalies such as Lake Erie loop flow, or the
premiums that generators must pay for gas in the day-
"[A]djustments for these conditions should not be made ... [A]lthough large anomalous
events with measurable effects may not even out over a relatively brief three-
The prior Demand Curve study used the Handy-
NYISO ICAP Demand Curve Filing
Copyright 2010 Energy Choice Matters. If you wish to share this story, please email or post the website link; unauthorized copying, retransmission, or republication prohibited.
Be Seen By Energy Professionals in Retail and Wholesale Marketing
Run Ads with Energy Choice Matters
Call Paul Ring
954-

|
Consulting |
Abbreviations |
Search |